Organization
Describe your structure. OrgGen draws your holding.
Describe your group structure, OrgGen draws the org chart — holding, subsidiaries, stakes, teams. Editable, not a frozen PNG.
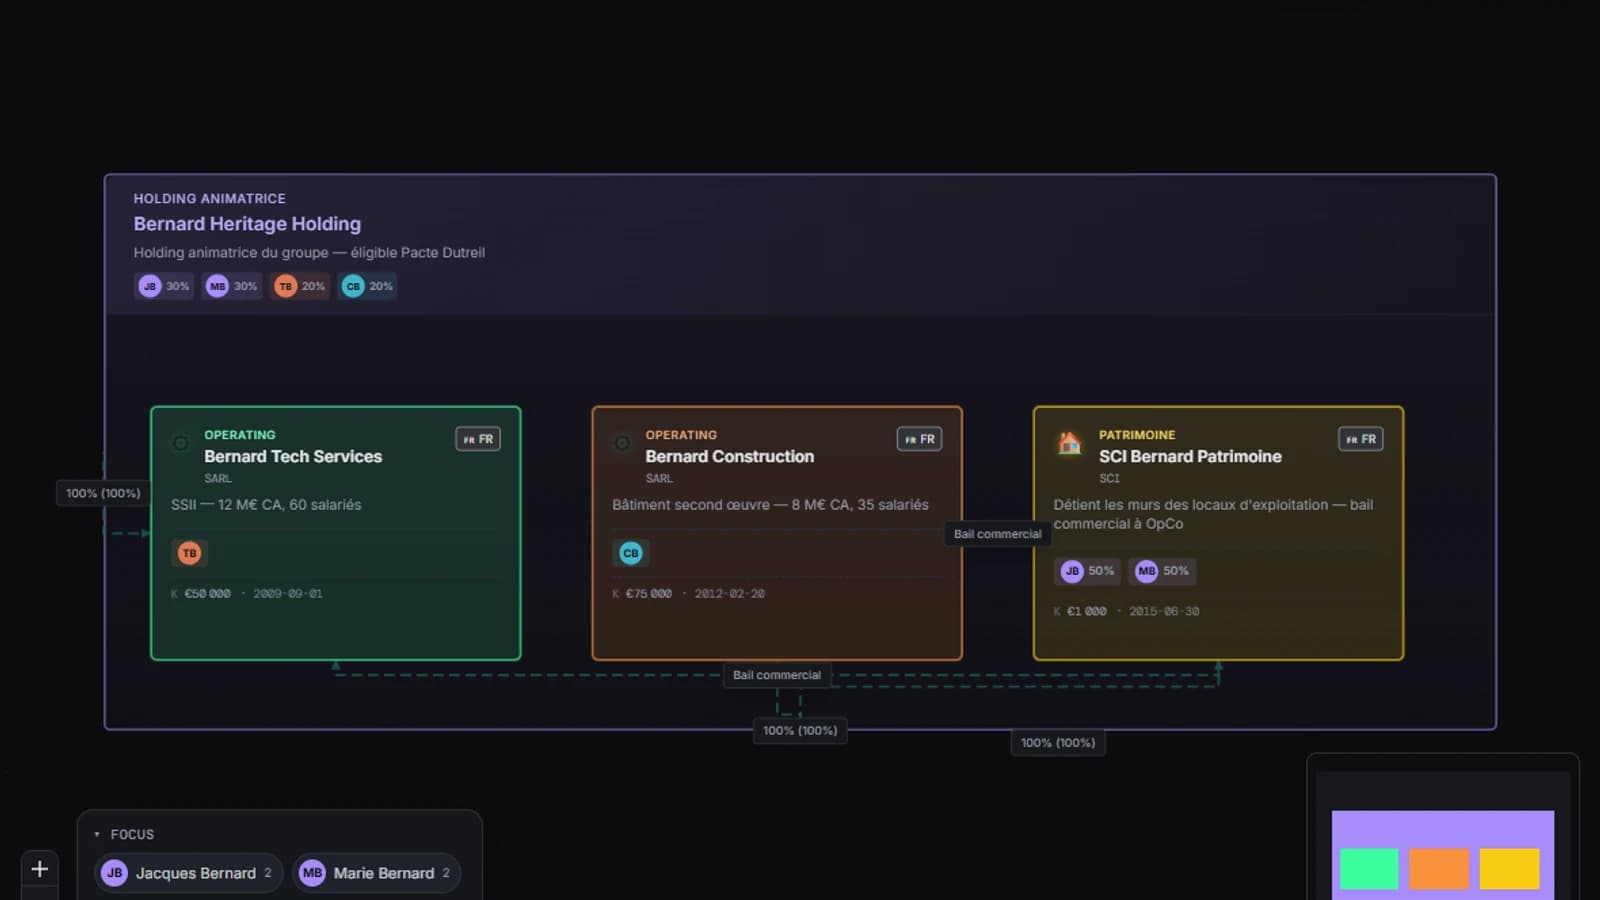
Organization
- 01
Nested holdings, no depth limit
Parent company → subsidiaries → sub-subsidiaries → business units. Every level carries its own ownership percentages, assigned people, and status — not a template of frozen boxes, a real editable hierarchy.
- 02
People, shares, and roles
Assign people to any entity, track share percentages, categorize by role and level. One click on a person grays out everything unrelated to them — instant visibility into who does what, where.
- 03
The cap table, right there
Most tools keep the org chart and equity split separate. At OrgGen, the holding structure AND each entity's cap table live on the same canvas — with a built-in what-if dilution simulator.
- 04
Described in natural language
"Create a holding with 3 subsidiaries: tech, sales, real estate" is enough. The AI builds the hierarchy, you then adjust it by chatting or directly on the canvas — inline double-click editing, no menus.
- 05
Rich content per block
Every entity carries its own notes, tracked actions (assignee, due date, status), links. The subsidiary's action plan lives ON the schema, not in a separate file nobody remembers to update.
- 06
Structural and business dependencies
Automatic ownership links between parent and child, plus explicit business dependencies (contract, partnership, flow) between any entities in the group — orthogonal, never a stray diagonal.
A holding structure visualizer, not a template
Classic org-chart generators produce a frozen image — you start from scratch every time something changes. OrgGen keeps the structure alive: you describe it in natural language, your holding's hierarchy builds itself, and every entity stays editable — inline on the canvas, or by chatting with the AI again. Add each subsidiary's equity split and you get a complete equity org chart, not just a drawing.
Use cases: say it, get it
- Prompt
Create a holding group with 3 subsidiaries: tech, sales, real estate
- Prompt
Add Alice (CTO) to the tech subsidiary, Bob (CMO) to the sales subsidiary
- Prompt
Create a structure with a parent company and 2 sub-subsidiaries owned at 60%
- Prompt
Add a 'Product' vertical attached to the group, with 3 squads
Frequently asked questions
Is the generated diagram editable, or just a static image?
The canvas stays editable: every block is editable inline (double-click), by drag-and-drop, or by continuing the conversation with the AI. Unlike a flattened export, you can come back and reshape the structure at any time.
Does OrgGen also handle the cap table?
Yes, on the same canvas as your org chart: dilution simulation, successive rounds, SAFEs, ESOP, and a one-click investor-ready fundraising package.
What kinds of diagrams can OrgGen AI generate?
Six kinds are available today: holding org charts, conceptual data models (ERD), software architecture (C4), business processes (BPMN-lite), customer journeys, and cap tables. One connected AI model, not six separate tools.
What diagrams can you generate?
Ready to visualize your structure?
Describe your holding in natural language — OrgGen produces an editable org chart in seconds.